Tracking how people are getting to your sites and what’s performing well is very important in order to be competitive in the online market, and you can do it by using Google Analytics: we can teach you how.
Adding the code
Once you have created your Google Analytics account, you’ll need to incorporate the code in your website: set up a profile for the site you’d like to track (you can track multiple site if you need) and a step-by-step process will generate a unique script, to be implemented in each page of the site.
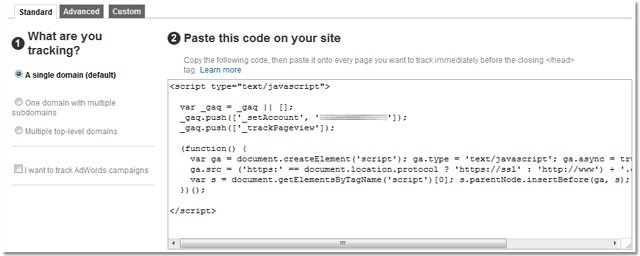
Copy the JavaScript code from Analytics and paste it just above the </head> tag in your page or template. Adding this code will not affect the look of your site.
What you can measure
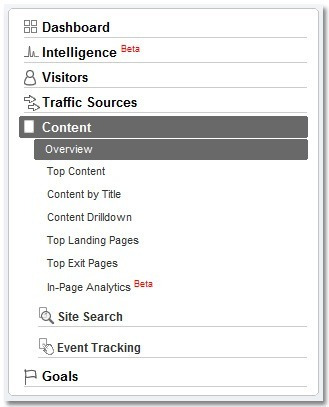
After connecting your site to Analytics, click on “view report”: this will lead you to the main dashboard. In the left column you will see the various types of data provided:
- Visitors: where they’re located, what language they speak, how often they visit your site, what browsers do they use.
- Traffic sources: how people reach your site, which links send to your page and what keywords are being used.
- Content: this part gives you insight into specific pages of your site, telling you which ones are more popular.
- Goals: you’ll find data about the desired actions from users, like purchases and information requests.
- Ecommerce: you’ll only need this if you’re selling items on your site.
Setting up the dashboard
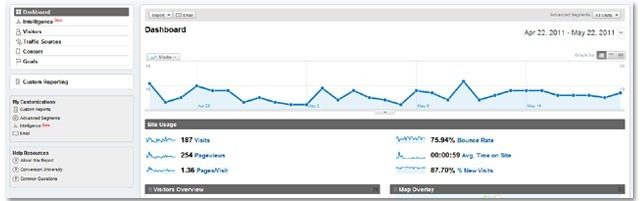
On the dashboard, where you can see a summarization of your site’s data, you can customize it to show whichever reports you want to see upfront.
Adjusting the time range
Be sure to adjust the time range in the upper right-hand corner to analyse the time frame of your interest: You can adjust it to track data quarterly, weekly, daily, or whatever timeframe you want.
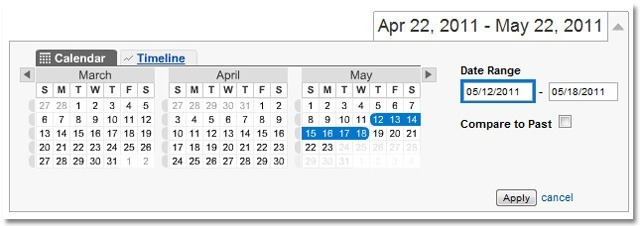
If you want to compare timeframes, click on “comparison” and it will bring up a second calendar to be adjusted to your liking.
Data tables and visualizations
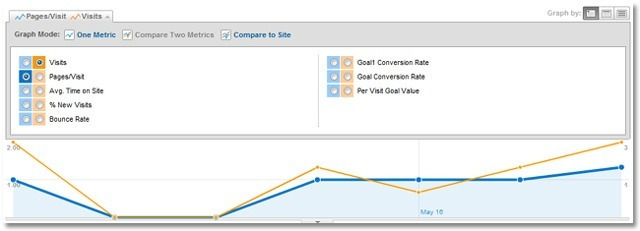
A lot of the reports in Google Analytics have linear graphs that can be used to discern measurements on the selected topic for that day, week or month.
You can change the metric you want to visualize, you can compare two metrics against each other or, if you’re not using date ranges, you can compare them against the site average.
Beneath the graph you’ll see more data shown with summaries and scorecards with important overall metrics; more raw measurements of these data can be found below in a table that can be visualized in a pie chart or a bar graph.
If you’re not sure of the meaning of a specific measurement, click on the question mark next to it.
Sharing Reports
You’ll find an email button at the top of all reports, just beneath the title: you can send the email immediately, arrange a recurring report email or add it to an existing pre-scheduled email.
Source article on mashable.com
Are you still having problems with dealing with Google Analytics? Contact us!